GazePlotter Basic Guide
GazePlotter is a free web application for analyzing eye-tracking data. Simply visit gazeplotter.com to start analyzing your data immediately. No registration or installation required.
Quick Start
Step 1: Open GazePlotter
- Go to gazeplotter.com
- You'll see a demo visualization with sample data
Step 2: Upload Your Data
- Click "Import workspace or data" at the top
- Select your eye-tracking data file
- GazePlotter automatically detects the file type and creates visualizations
Step 3: Explore Your Data
- Use the controls in each plot to switch between participants, stimuli, and time views
- Click and drag plots to move them around
- Use the workspace toolbar to add more visualizations
Step 4: Save Your Work
- Click "Export workspace or data" to save your analysis
- Choose "Workspace" to save everything for later or sharing with colleagues
Main Workspace Controls
At the top of the GazePlotter workspace, you'll find these essential controls:
- Import workspace or data - Upload your eye-tracking data files (automatically detects file type)
- Reload Demo - Reset to the sample data if you want to start over
- Export workspace or data - Save your analysis or export data for other tools
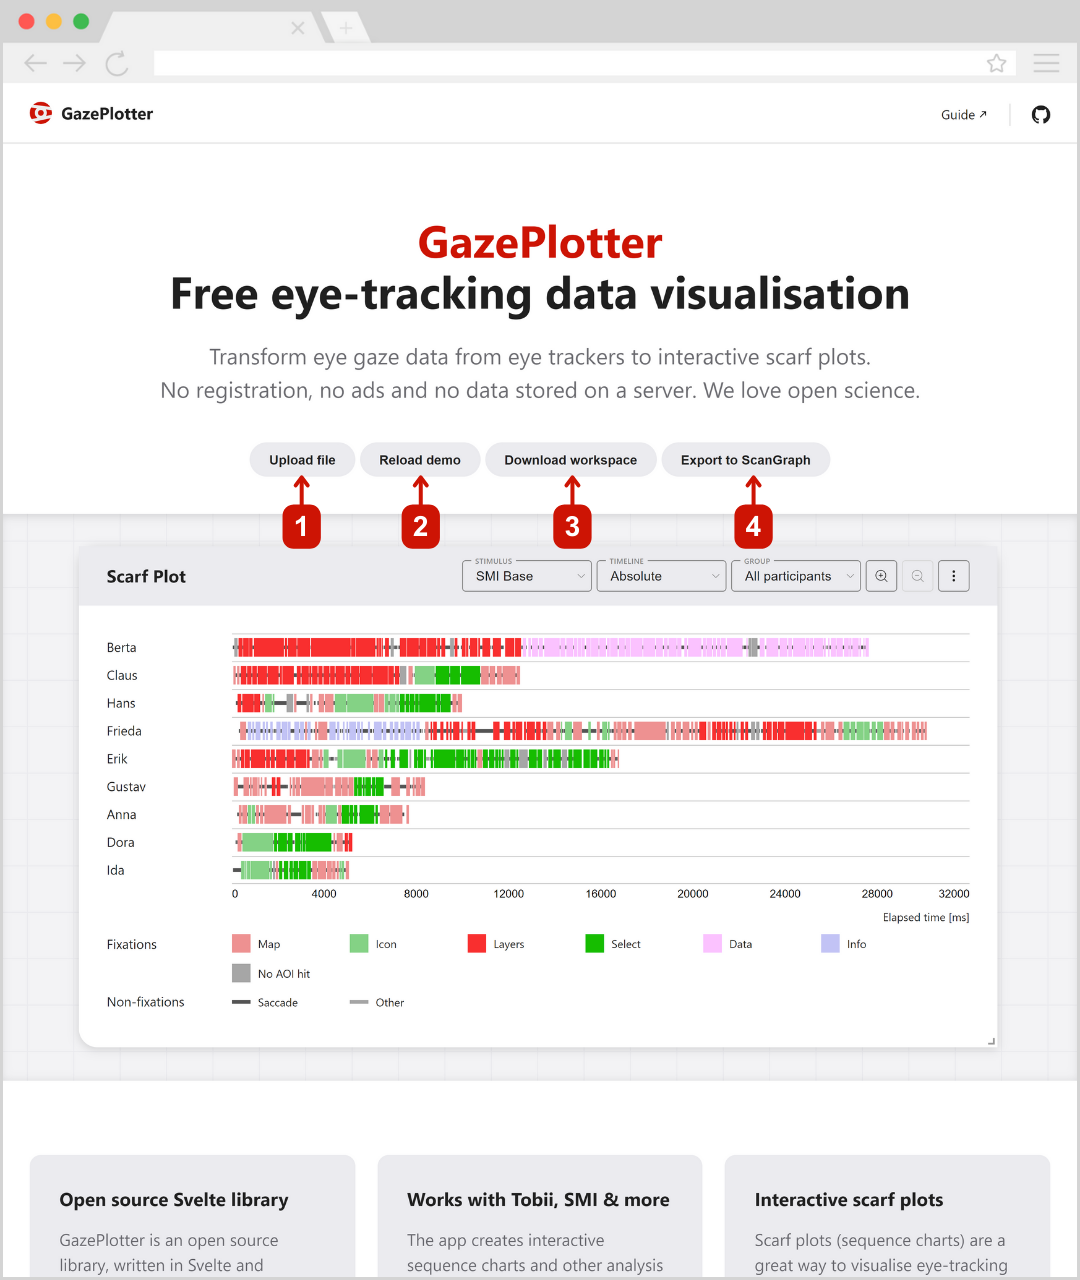
Understanding the Interface
When you first open GazePlotter, you'll see a scarf plot (timeline visualization) showing sample data. This demo includes:
- 2 stimuli (different images or screens participants looked at)
- 6 AOIs (Areas of Interest - specific regions in the images)
- 9 participants (people whose eye movements were recorded)
- 3 participant groups (organized for comparison)
Types of Visualizations
GazePlotter offers three main ways to view your eye-tracking data:
- Scarf Plot - Timeline view showing the sequence of where people looked over time
- Bar Plot - Bar charts comparing how much time was spent in different areas
- Transition Matrix - Heat map showing how gaze moved between areas
Customizing Your Analysis
You can personalize how your data appears and is organized:
- AOI Customization - Change colors, names, and order of areas of interest
- Stimuli Customization - Rename and organize your images/screens
- Participant Grouping - Create groups to compare different types of participants
- Participant Customization - Rename participants for easier identification
What You Can Do
Basic Operations:
- Upload data from any major eye-tracking software
- View data in three different visualization types
- Move and resize plots by dragging
- Add multiple plots to compare different views
- Save your work to continue later or share with others
Advanced Features:
- Customize colors and names of areas of interest
- Group participants for comparative analysis
- Export data for use in other analysis tools
- Create multiple workspaces for different projects
Export Options
For exporting data and workspaces, see the dedicated Export section which covers workspace export, segmented data export, and ScanGraph integration.