Workspace
The workspace is your main analysis area in GazePlotter. Think of it as your dashboard where you can:
- View multiple visualizations at the same time
- Compare different data views side by side
- Organize your analysis by moving and resizing plots
- Create custom layouts that suit your workflow
This guide shows you how to work with plots in the workspace - the essential skills every GazePlotter user needs.
Getting Started with Plots
Your first plot: When you upload data, GazePlotter automatically creates a scarf plot, a bar plot and a transition matrix. This is your starting point.
Adding more plots: Use the "Add Visualization" button in the left toolbar to create more plots.
Basic plot operations: Every plot can be moved, resized, duplicated, or removed. These are the fundamental skills you'll use most often.
Workspace Toolbar
Vertical control panel on the left side providing quick workspace management:
- Reset Layout - Reorganize plots into clean grid layout
- Add Visualization - Create new scarf plots, bar plots, or transition matrices
- Toggle Fullscreen - Distraction-free analysis mode
- Source Metadata - View detailed information about your data processing and system usage (details)
Workspace Export & State Preservation
Workspace export creates comprehensive JSON files, which can be re-uploaded, preserving:
- Complete Layout - Exact plot positions and sizes
- Plot Configurations - All visualization settings and customizations
- Participant Groupings - Custom groups for comparative analysis
- AOI Customizations - Colors, names, and visual properties
- Filter Settings - Data filtering and selection criteria
- Visualization Types - All plot types with specific settings
Workspace Management
Use workspace export frequently to save your analysis configurations. The JSON files are small and perfect for:
- Collaboration - Share complete dashboards with team members
- Backup - Save analysis configurations before making changes
- Templates - Create reusable layouts for similar projects
- Transfer - Move workspaces between devices or systems
- Version Control - Track changes and maintain project history
Manipulating Plots in the Workspace
Drag-and-drop interface for plot management. More options in individual plots (see Scarf plot).
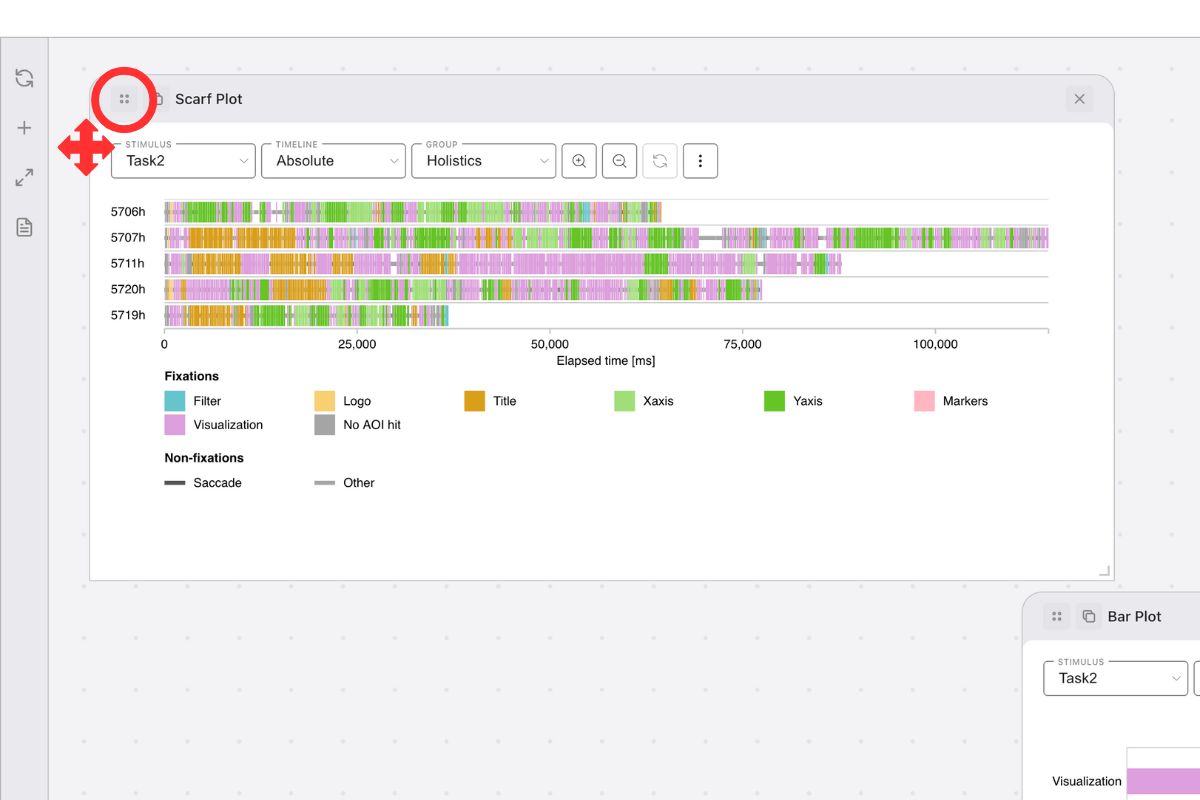
How to move a plot around workspace?
- Click and drag drag handle (4 dots icon) in plot header
- Plots snap to 50x50 pixel grid
- Workspace expands automatically at edges
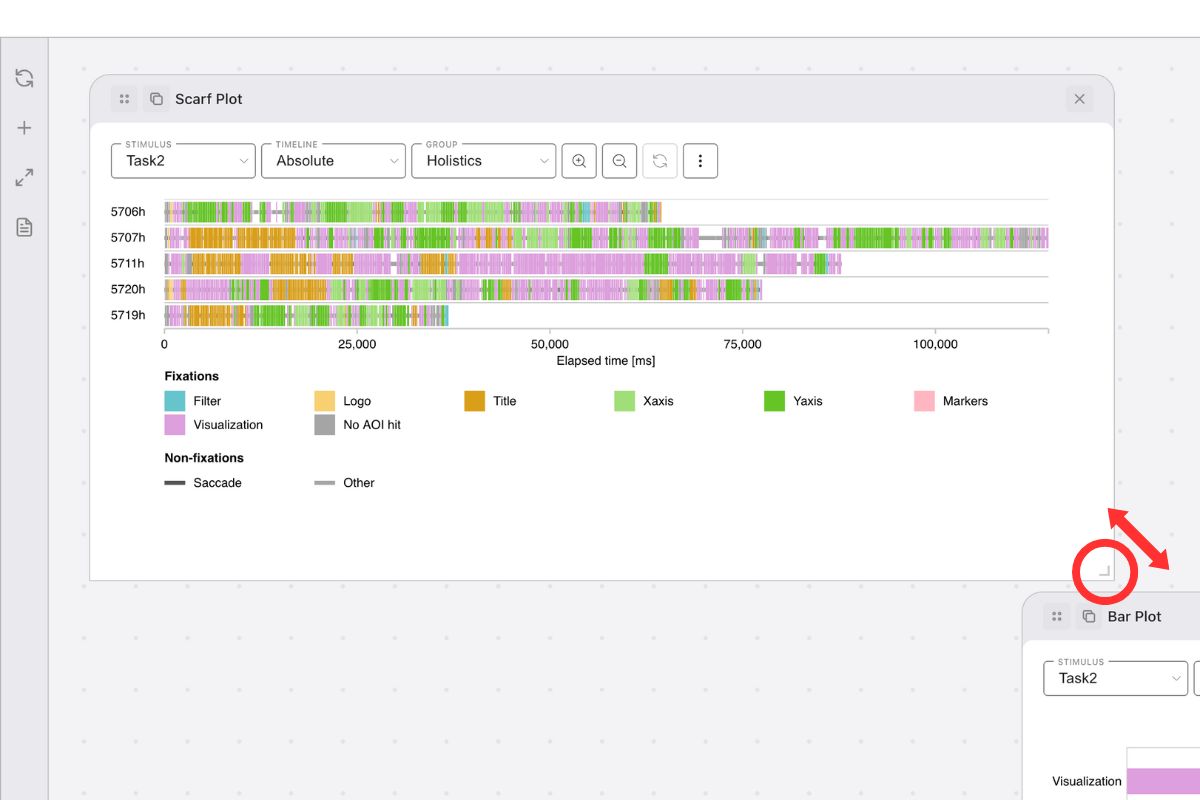
How to resize a plot?
- Drag bottom-right corner to resize
- Maintains proportional sizing on 50x50 pixel grid
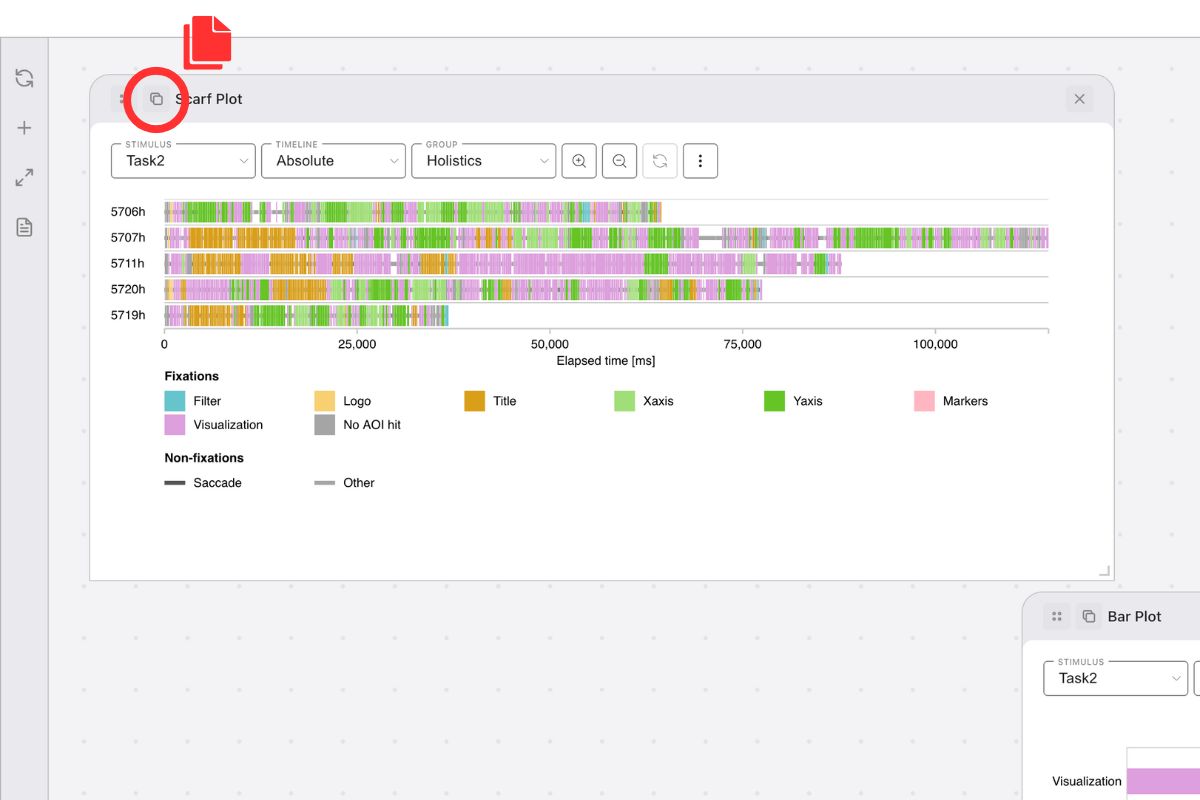
How to duplicate a plot?
Duplicating a plot creates an identical copy with all current settings preserved. This includes any applied participant groups, stimulus selections, axis adjustments, custom color palettes, AOI customizations, and all other visualization configurations. The duplicated plot appears in the same workspace and can be moved, resized, or further customized independently.
- Click the Duplicate button (copy icon) in the plot header at the top-left corner
- The duplicated plot will appear in the nearest empty place
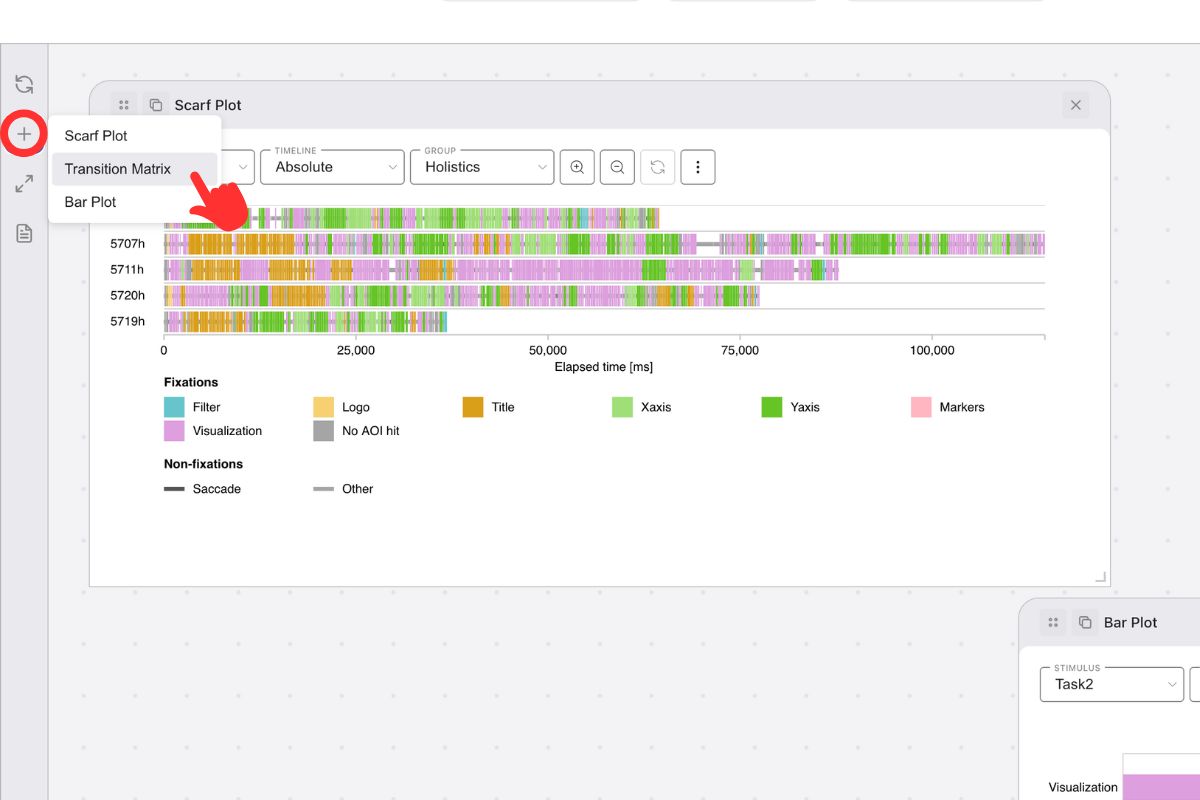
How to add a new plot?
- Click Add Visualization in the workspace toolbar (to the left of the workspace)
- Select one from available plot types
- The new plot will appear in the nearest empty place
How to remove a plot?
- Click the Remove button (X icon) in the plot header at the top-right corner
- The plot will be permanently removed from the workspace
