Scarf plot
Scarf plot (or sequential graph) is a visualization of eye movement data that shows the sequence of fixations and saccades in time. It is a useful tool for analyzing the order of fixations and saccades, and for comparing the scanpaths of different participants or stimuli. Specific areas of interest (AOIs) in the given stimuli are color-coded and displayed in the scarf plot. The scarf plot is the main visualization tool in GazePlotter, and it is used to visualize eye-tracking data from various eye-tracking software.
Scarf plot manipulations in Workspace
Interested on how to operate with plots in general within the workspace? See:
Basic controls
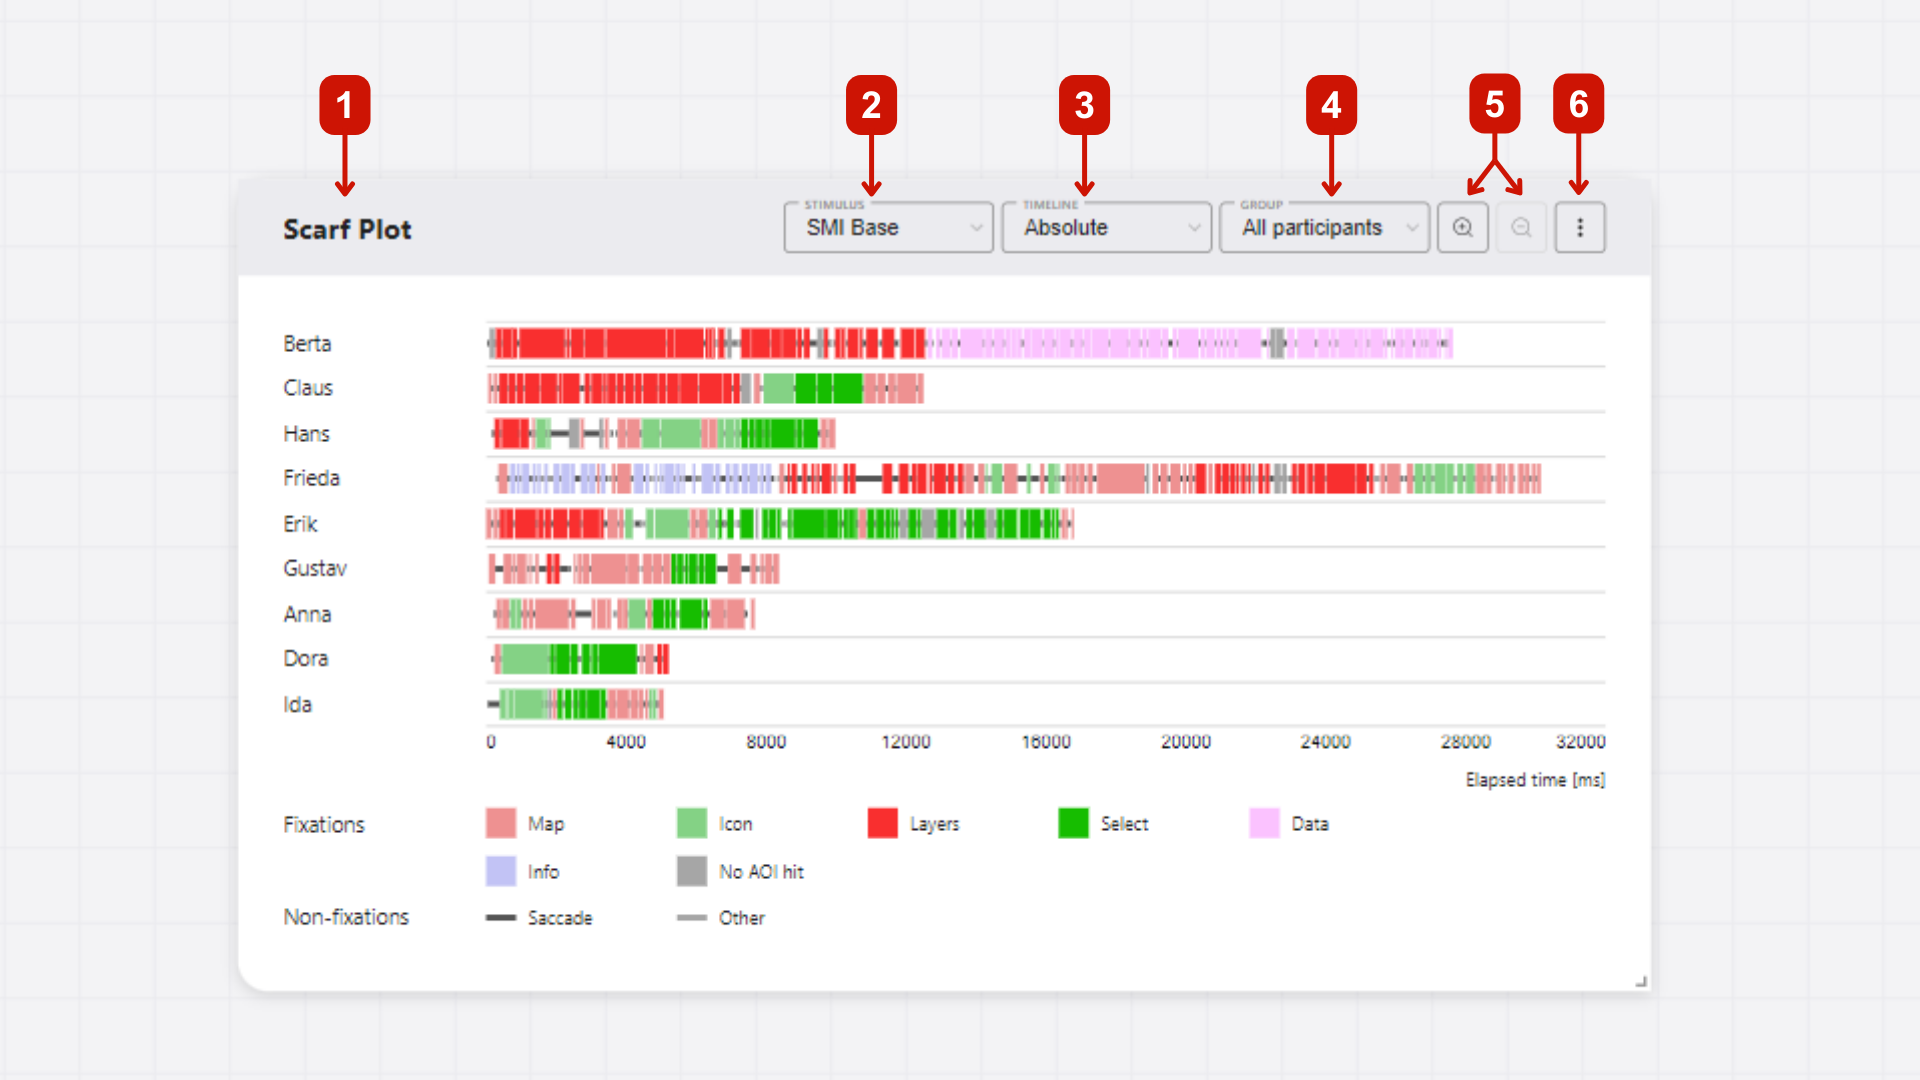
In GazePlotter, scarf plots have following main controls:
- Title - the title of the scarf plot, which can be changed by clicking on it.
- Stimulus selector - a drop-down menu for selecting the stimulus to be displayed in the scarf plot.
- Timeline selector - a drop-down menu for selecting the timeline type to be displayed in the scarf plot (absolute, relative, ordinal; see Timeline representations).
- Group selector - a drop-down menu for selecting the group of participants to be displayed in the scarf plot (see Groups).
- Zoom in/out - buttons for zooming in and out of the scarf plot.
- More options - a button for accessing additional options for the scarf plot (see More options).
Timeline representations
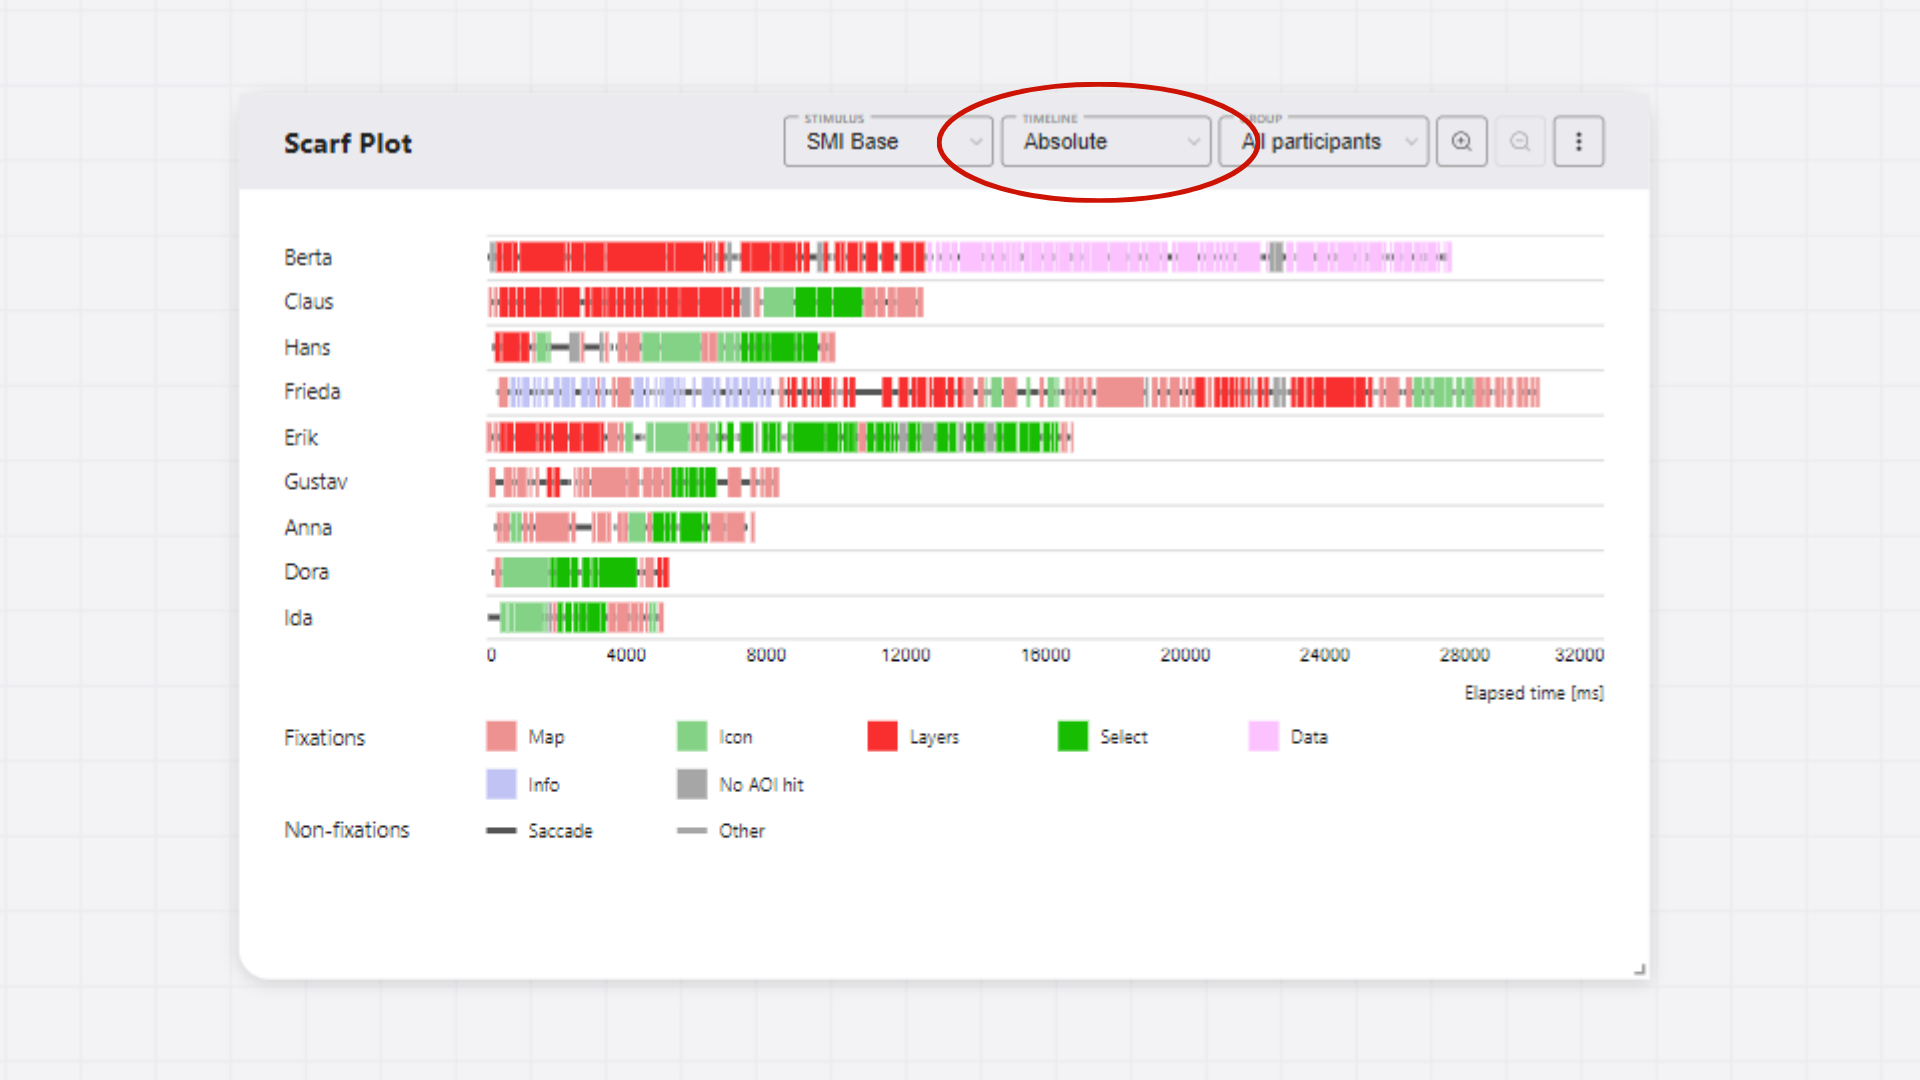
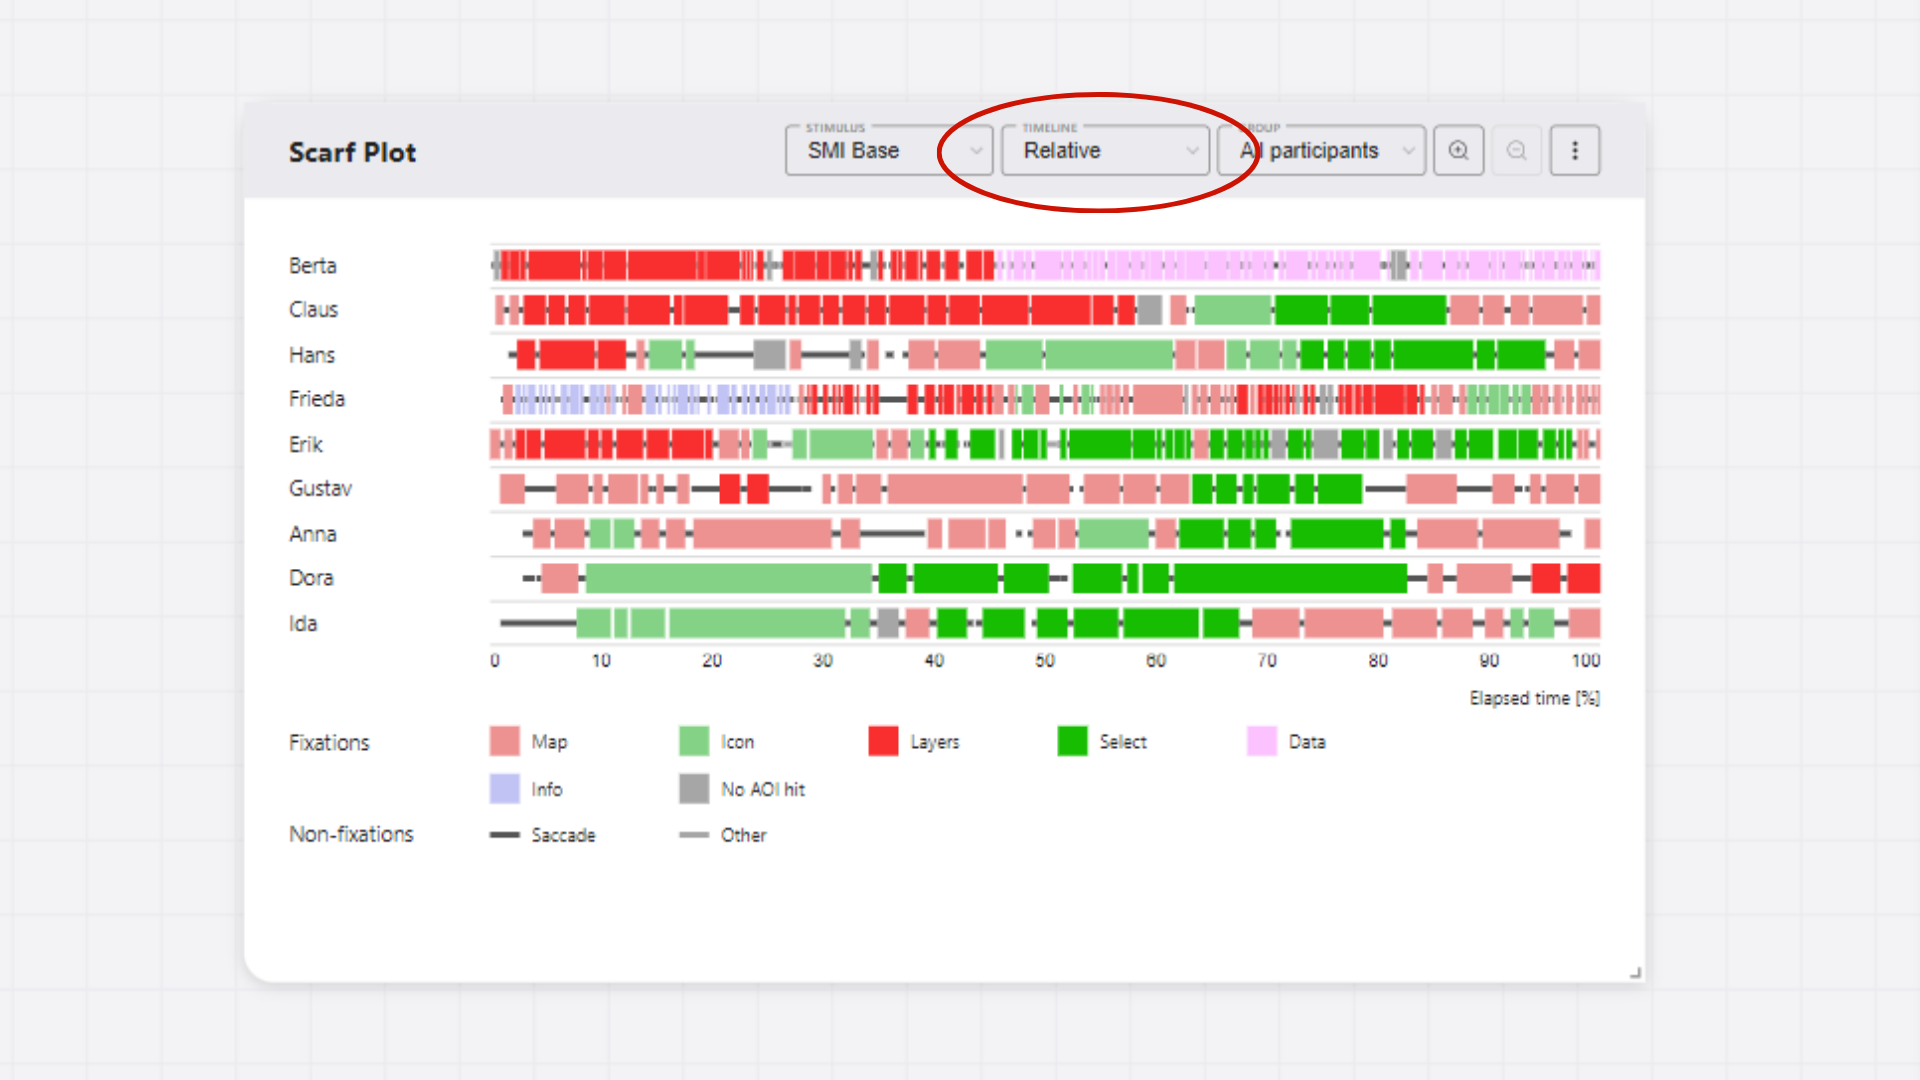
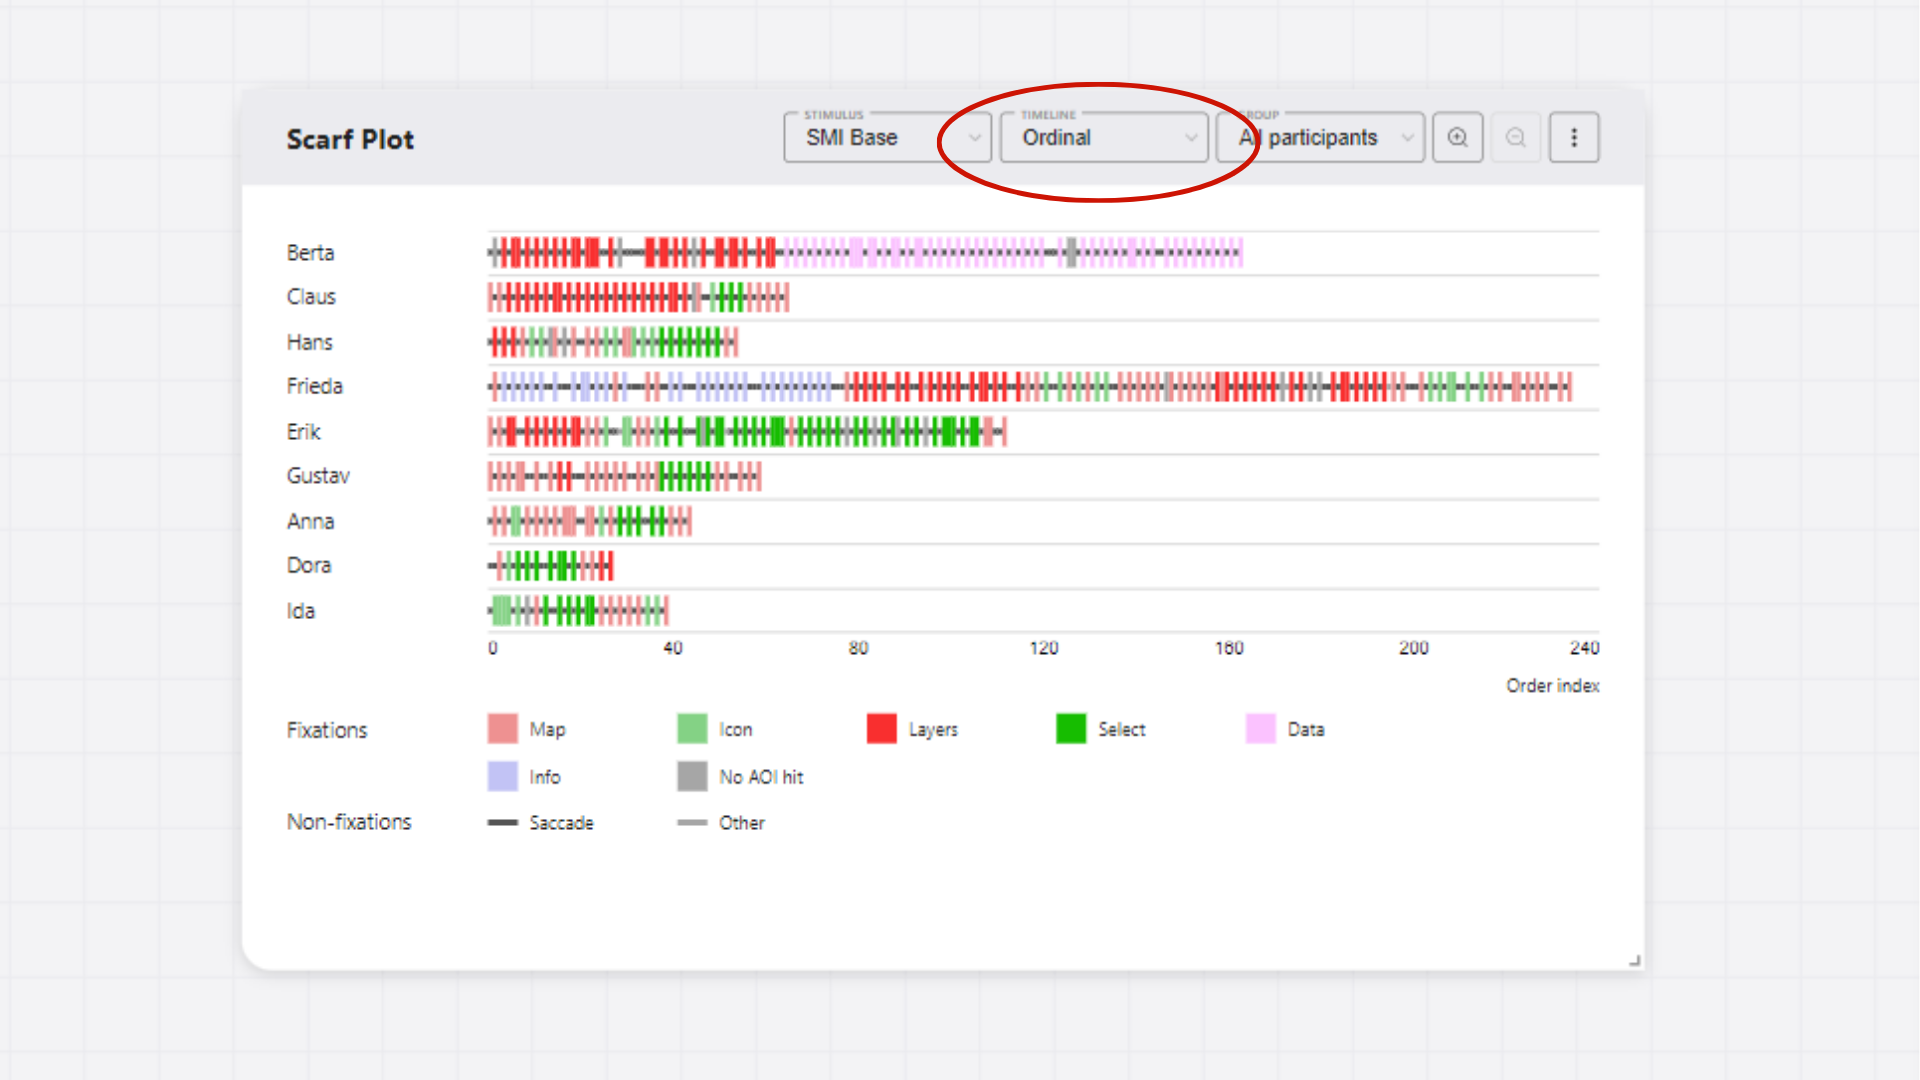
In GazePlotter's scarf plots, you can switch between different timeline representations just by clicking on the timeline representation button.
Available timelines in scarf plots
The following timeline representations are available:
- absolute time (in milliseconds)
- relative time (to the duration of the dwell time of the participant with the highest dwell time)
- ordinal time (just order indices of the individual fixations, saccades and other events like blinks)
DANGER
Some data, e.g. from OGAMA software, support only ordinal time representation.
Interactivity
The scarf plot is interactive. Except for the basic controls and dragging the scarf plot around the workspace, you can interact with the scarf plot to get more detailed information about fixations, saccades, and AOIs in the data or highlight specific segments of the data.
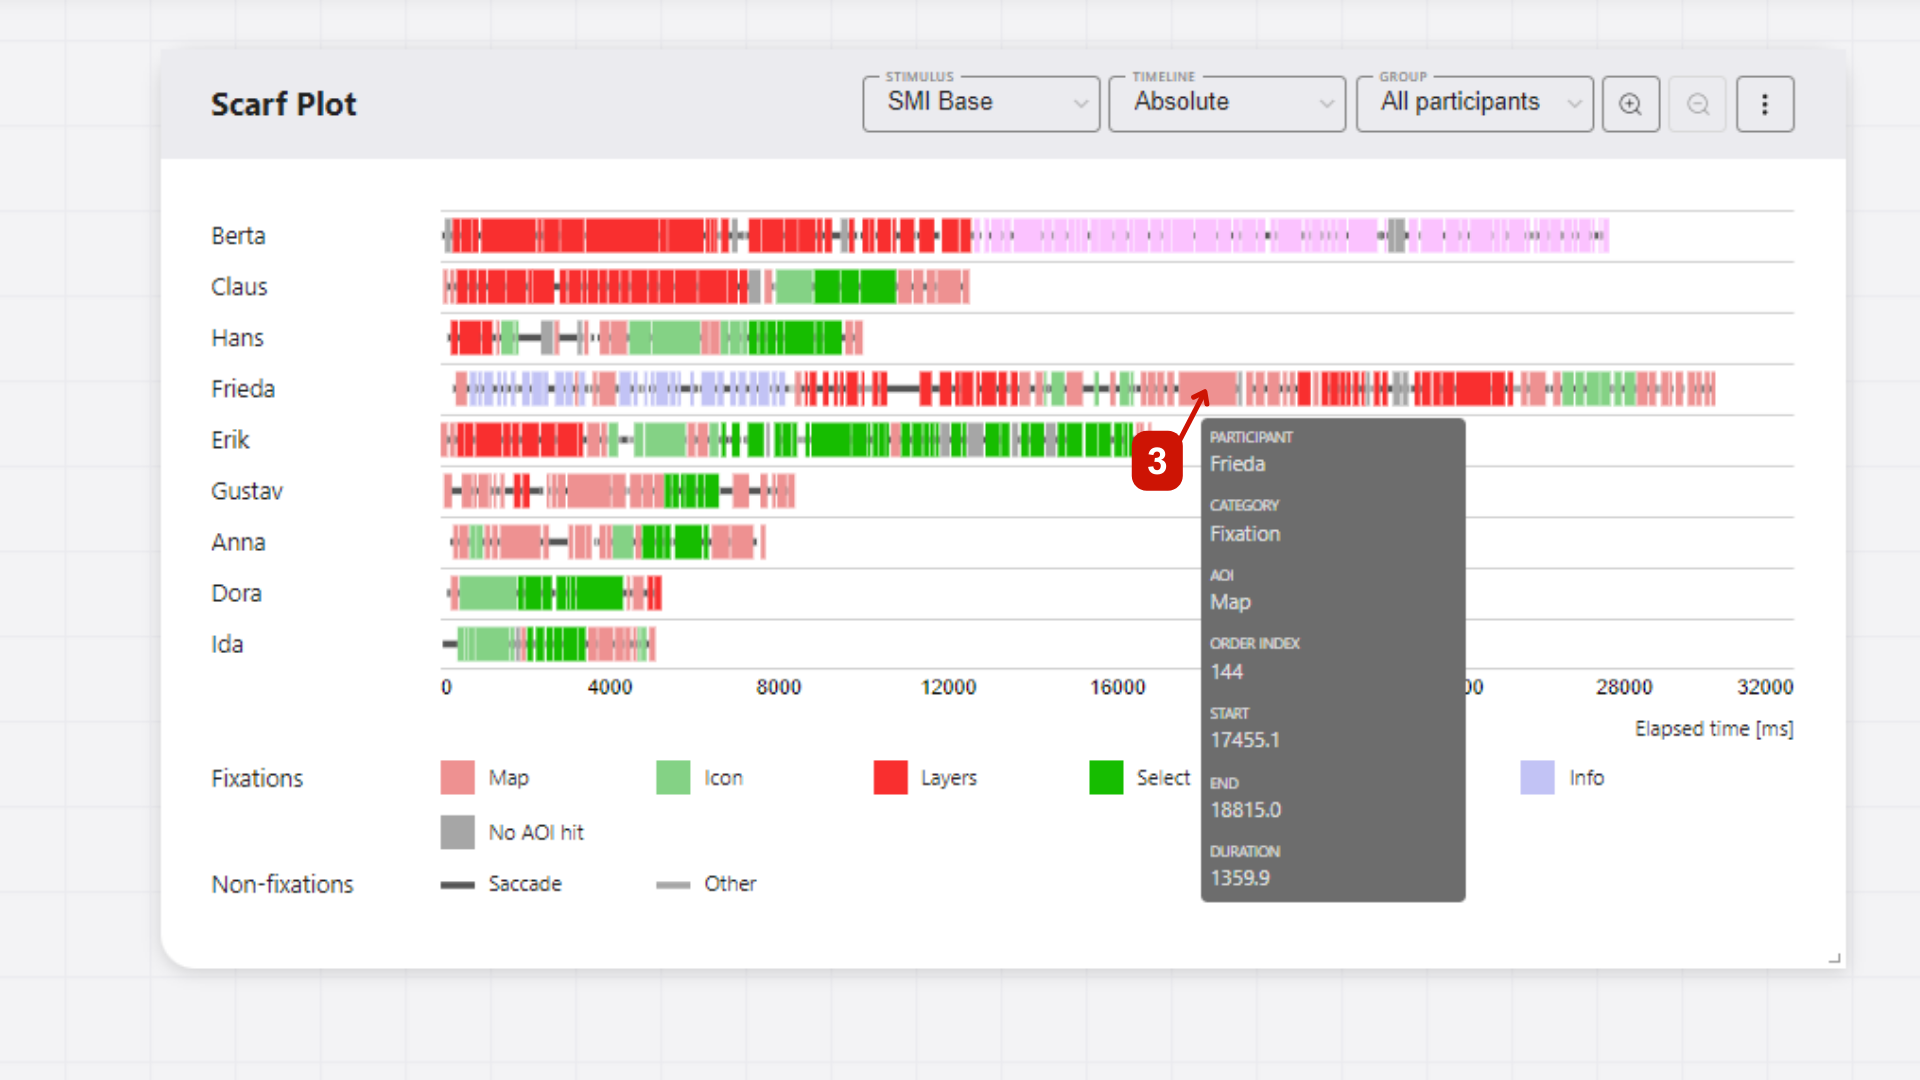
Sequence details
You can hover over fixations, saccades, and AOIs to see additional information, such as duration, start and end times, and AOI name. This information is displayed in a tooltip when you hover over the corresponding segment.
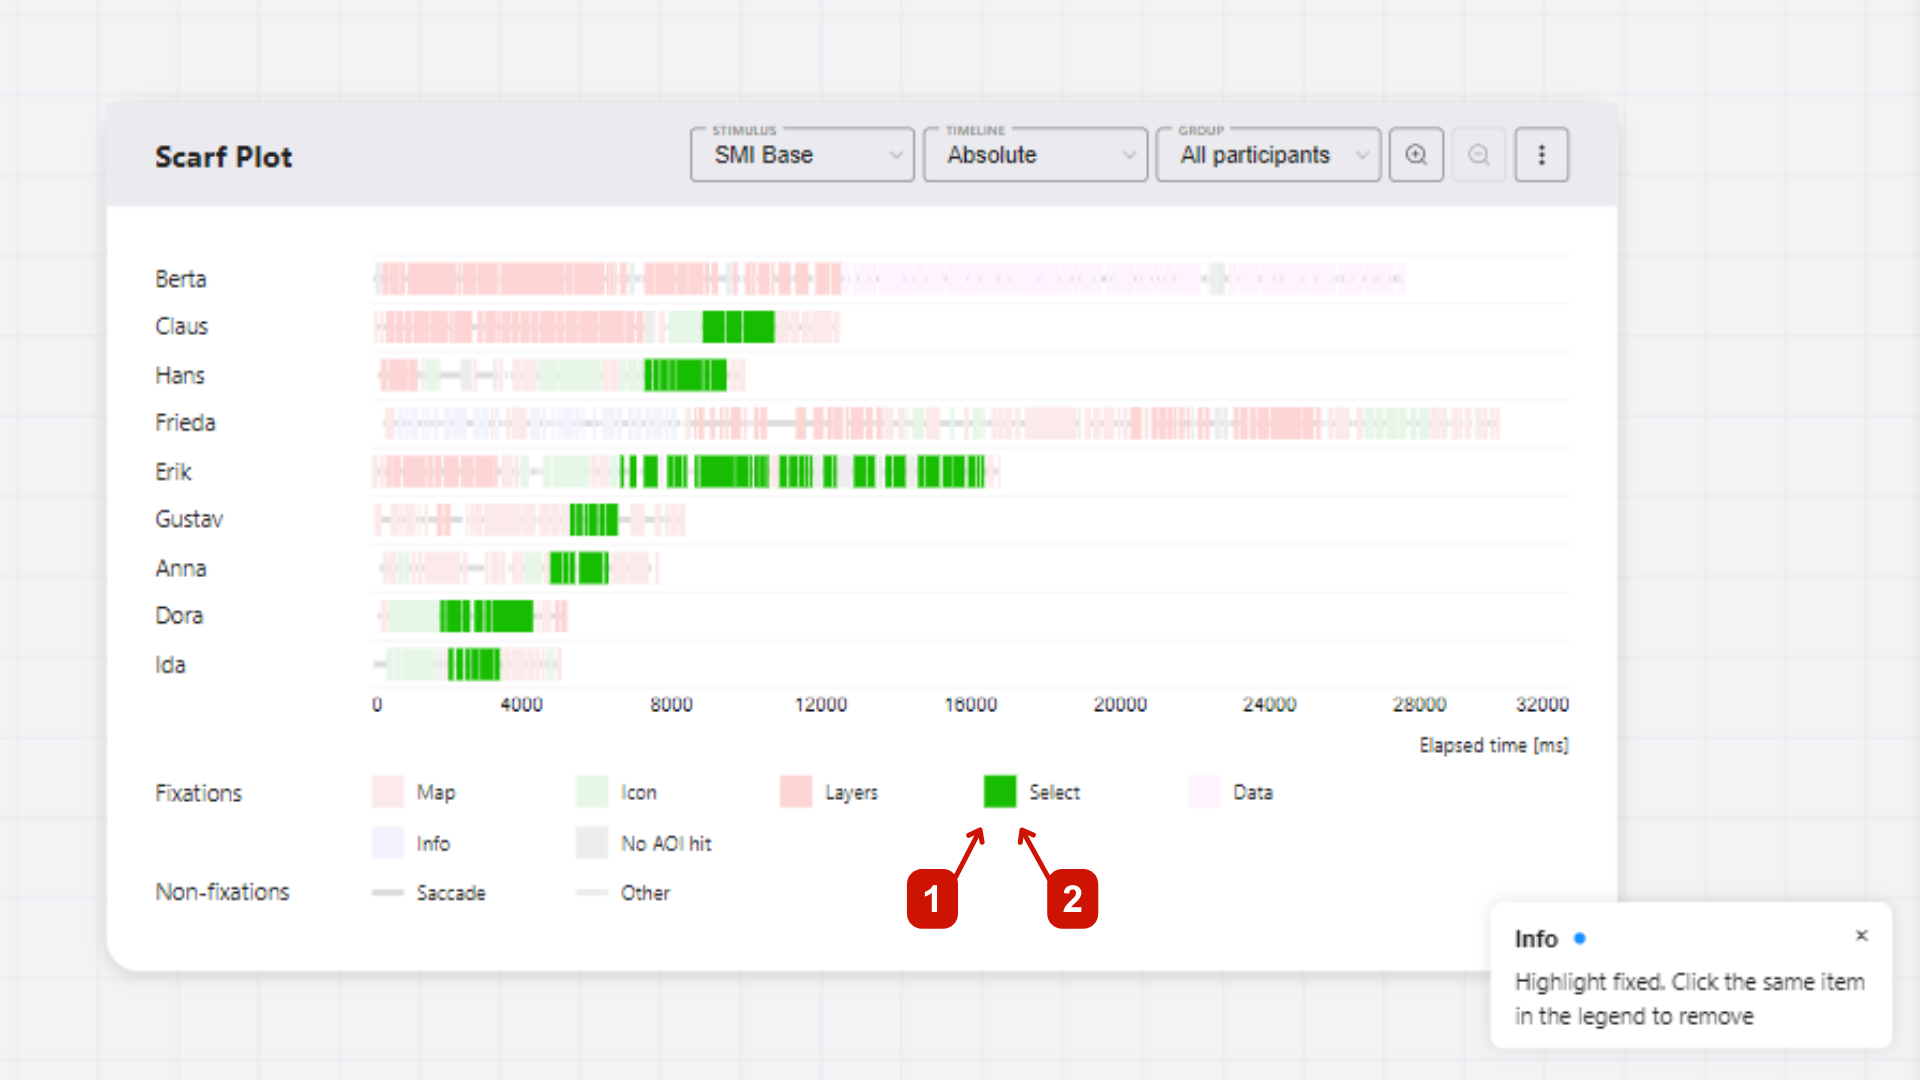
Highlighting
In the legend, you can highlight all segments of a specific category (fixations, saccades, or AOIs) by:
- Hovering over the category name in the legend to highlight all segments of that category temporarily.
- Clicking on the category name in the legend to highlight all segments of that category until you click on it again to remove the highlight.
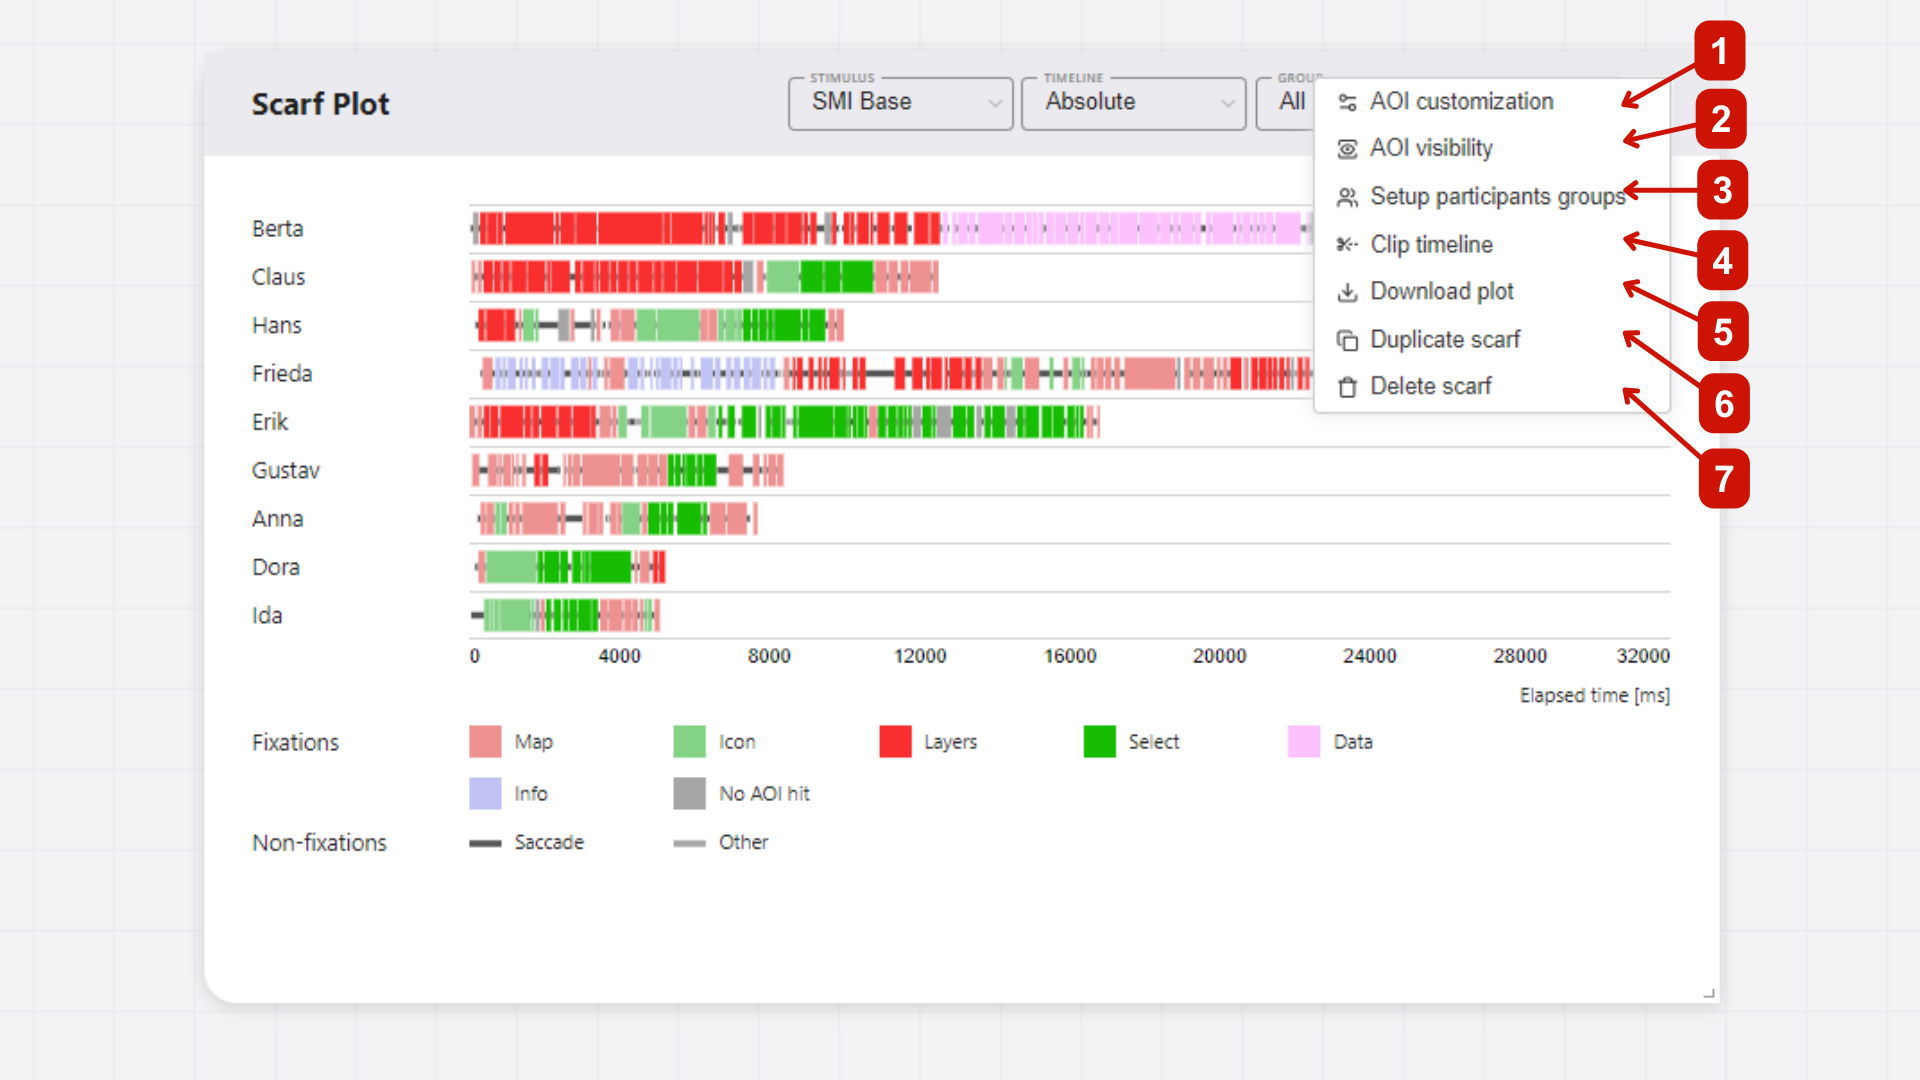
More options
After clicking on the More options button, a pop-up menu with additional options for the scarf plot will appear. The following options are available:
Customization Options
- AOI customization - Modify colors, names, and order of Areas of Interest. See AOI Customization for details.
- Stimulus customization - Manage stimulus properties and settings. See Stimuli Customization for details.
- Participant customization - Customize individual participant properties and metadata. See Participants Customization for details.
- Setup participants groups - Create and modify participant groups for comparative analysis. See Participant Groups for details.
Data and Timeline Options
- AOI visibility - Add dynamic AOI visibility data to enhance visualization (see Adding AOI visibility data).
- Clip timeline - Modify timeline ranges and limits for focused analysis (see Clipping the timeline).
Export Options
- Download plot - Export the scarf plot as an image file with customizable settings (see Download Plot).
- Export segmented data - Export processed eye-tracking data for external analysis (see Export Data).
Adding AOI visibility data
GazePlotter supports the upload of AOI visibility data, allowing for the effective visualization of dynamic AOIs and their visibility in the stimulus. This enhances interpretability of your eye-tracking data and allows for more detailed analysis.
Getting AOI visibility data
WARNING
This feature is available only for SMI BeGaze and Tobii Pro Lab data.
From SMI BeGaze
In the SMI BeGaze software, open AOI Editor. Export the AOI visibility data as .xml file by clicking Save button. In this file, you can find the information about the visibility of each AOI in a given stimulus.
The exported file can be then simply added to the workspace to already uploaded SMI BeGaze data, see below.
From Tobii Pro Lab
In the Tobii Pro Lab software, open AOI tab. Export the AOI visibility data as .xml file by clicking Export button. In this file, you can find the information about the visibility of each AOI in a given stimulus.
The exported file can be then simply added to the workspace to already uploaded Tobii Pro Lab data, see below.
Adding AOI visibility data to the workspace
As seen on Figure 1, adding AOI visibility data to the workspace have following steps:
- Click
More optionsbutton in the top right corner of the scarf plot with desired stimulus set. - In the pop-up menu, select
Add AOI visibility data. - In new window, select the
.xmlfile with AOI visibility data (either from SMI BeGaze or Tobii Pro Lab). - Select whether to add the AOI visibility data to all participants or only to the selected one.
- Click
Applybutton. The AOI visibility data will be added to the workspace.

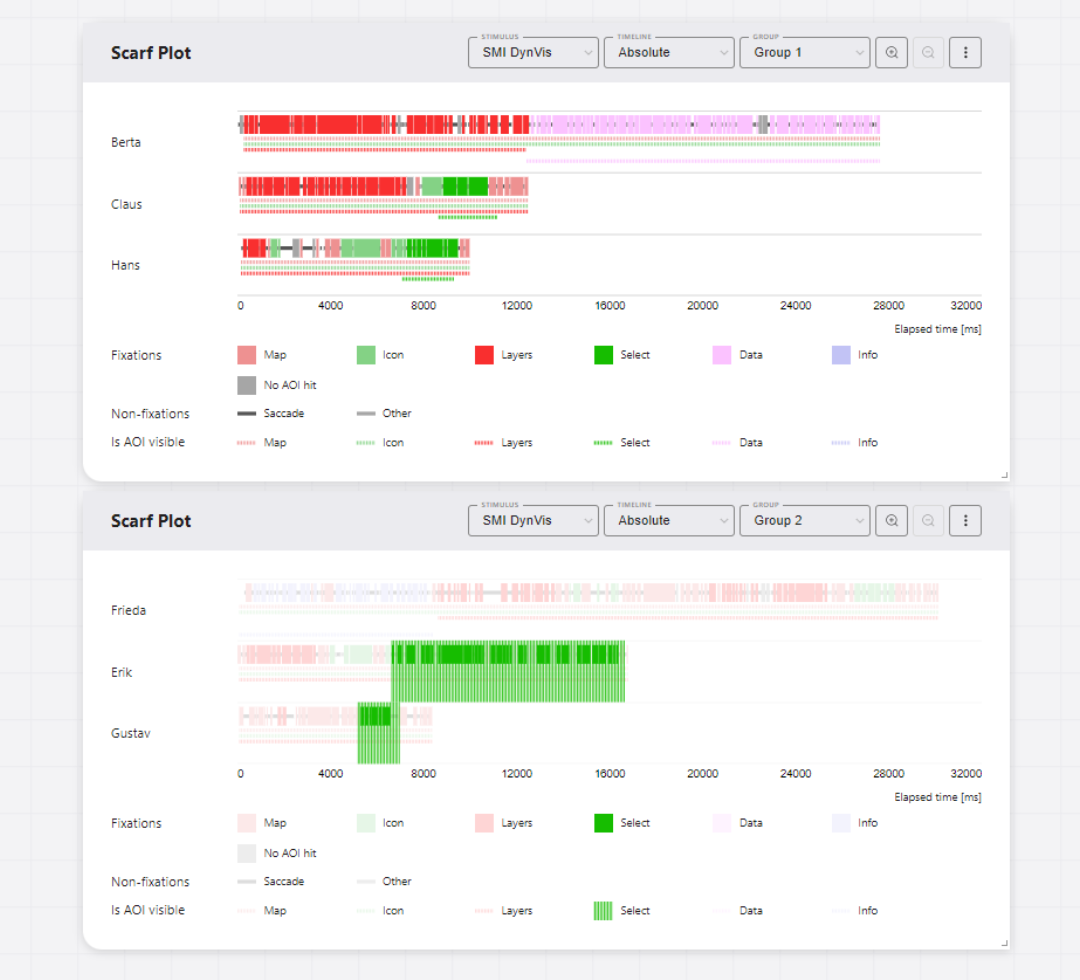
Interactivity of AOI visibility data
Each AOI visibility data is represented by a colored line. This is expanded and thus highlighted when the mouse is moved over the corresponding AOI category in the legend.
Clipping the timeline
Clip timeline is a feature in GazePlotter that allows you to clip the timeline of the scarf plot to a specific time interval. This can be useful for focusing on a specific part of the data, or unifying the timeline across multiple scarf plots for easier comparison.
Steps for clipping the timeline
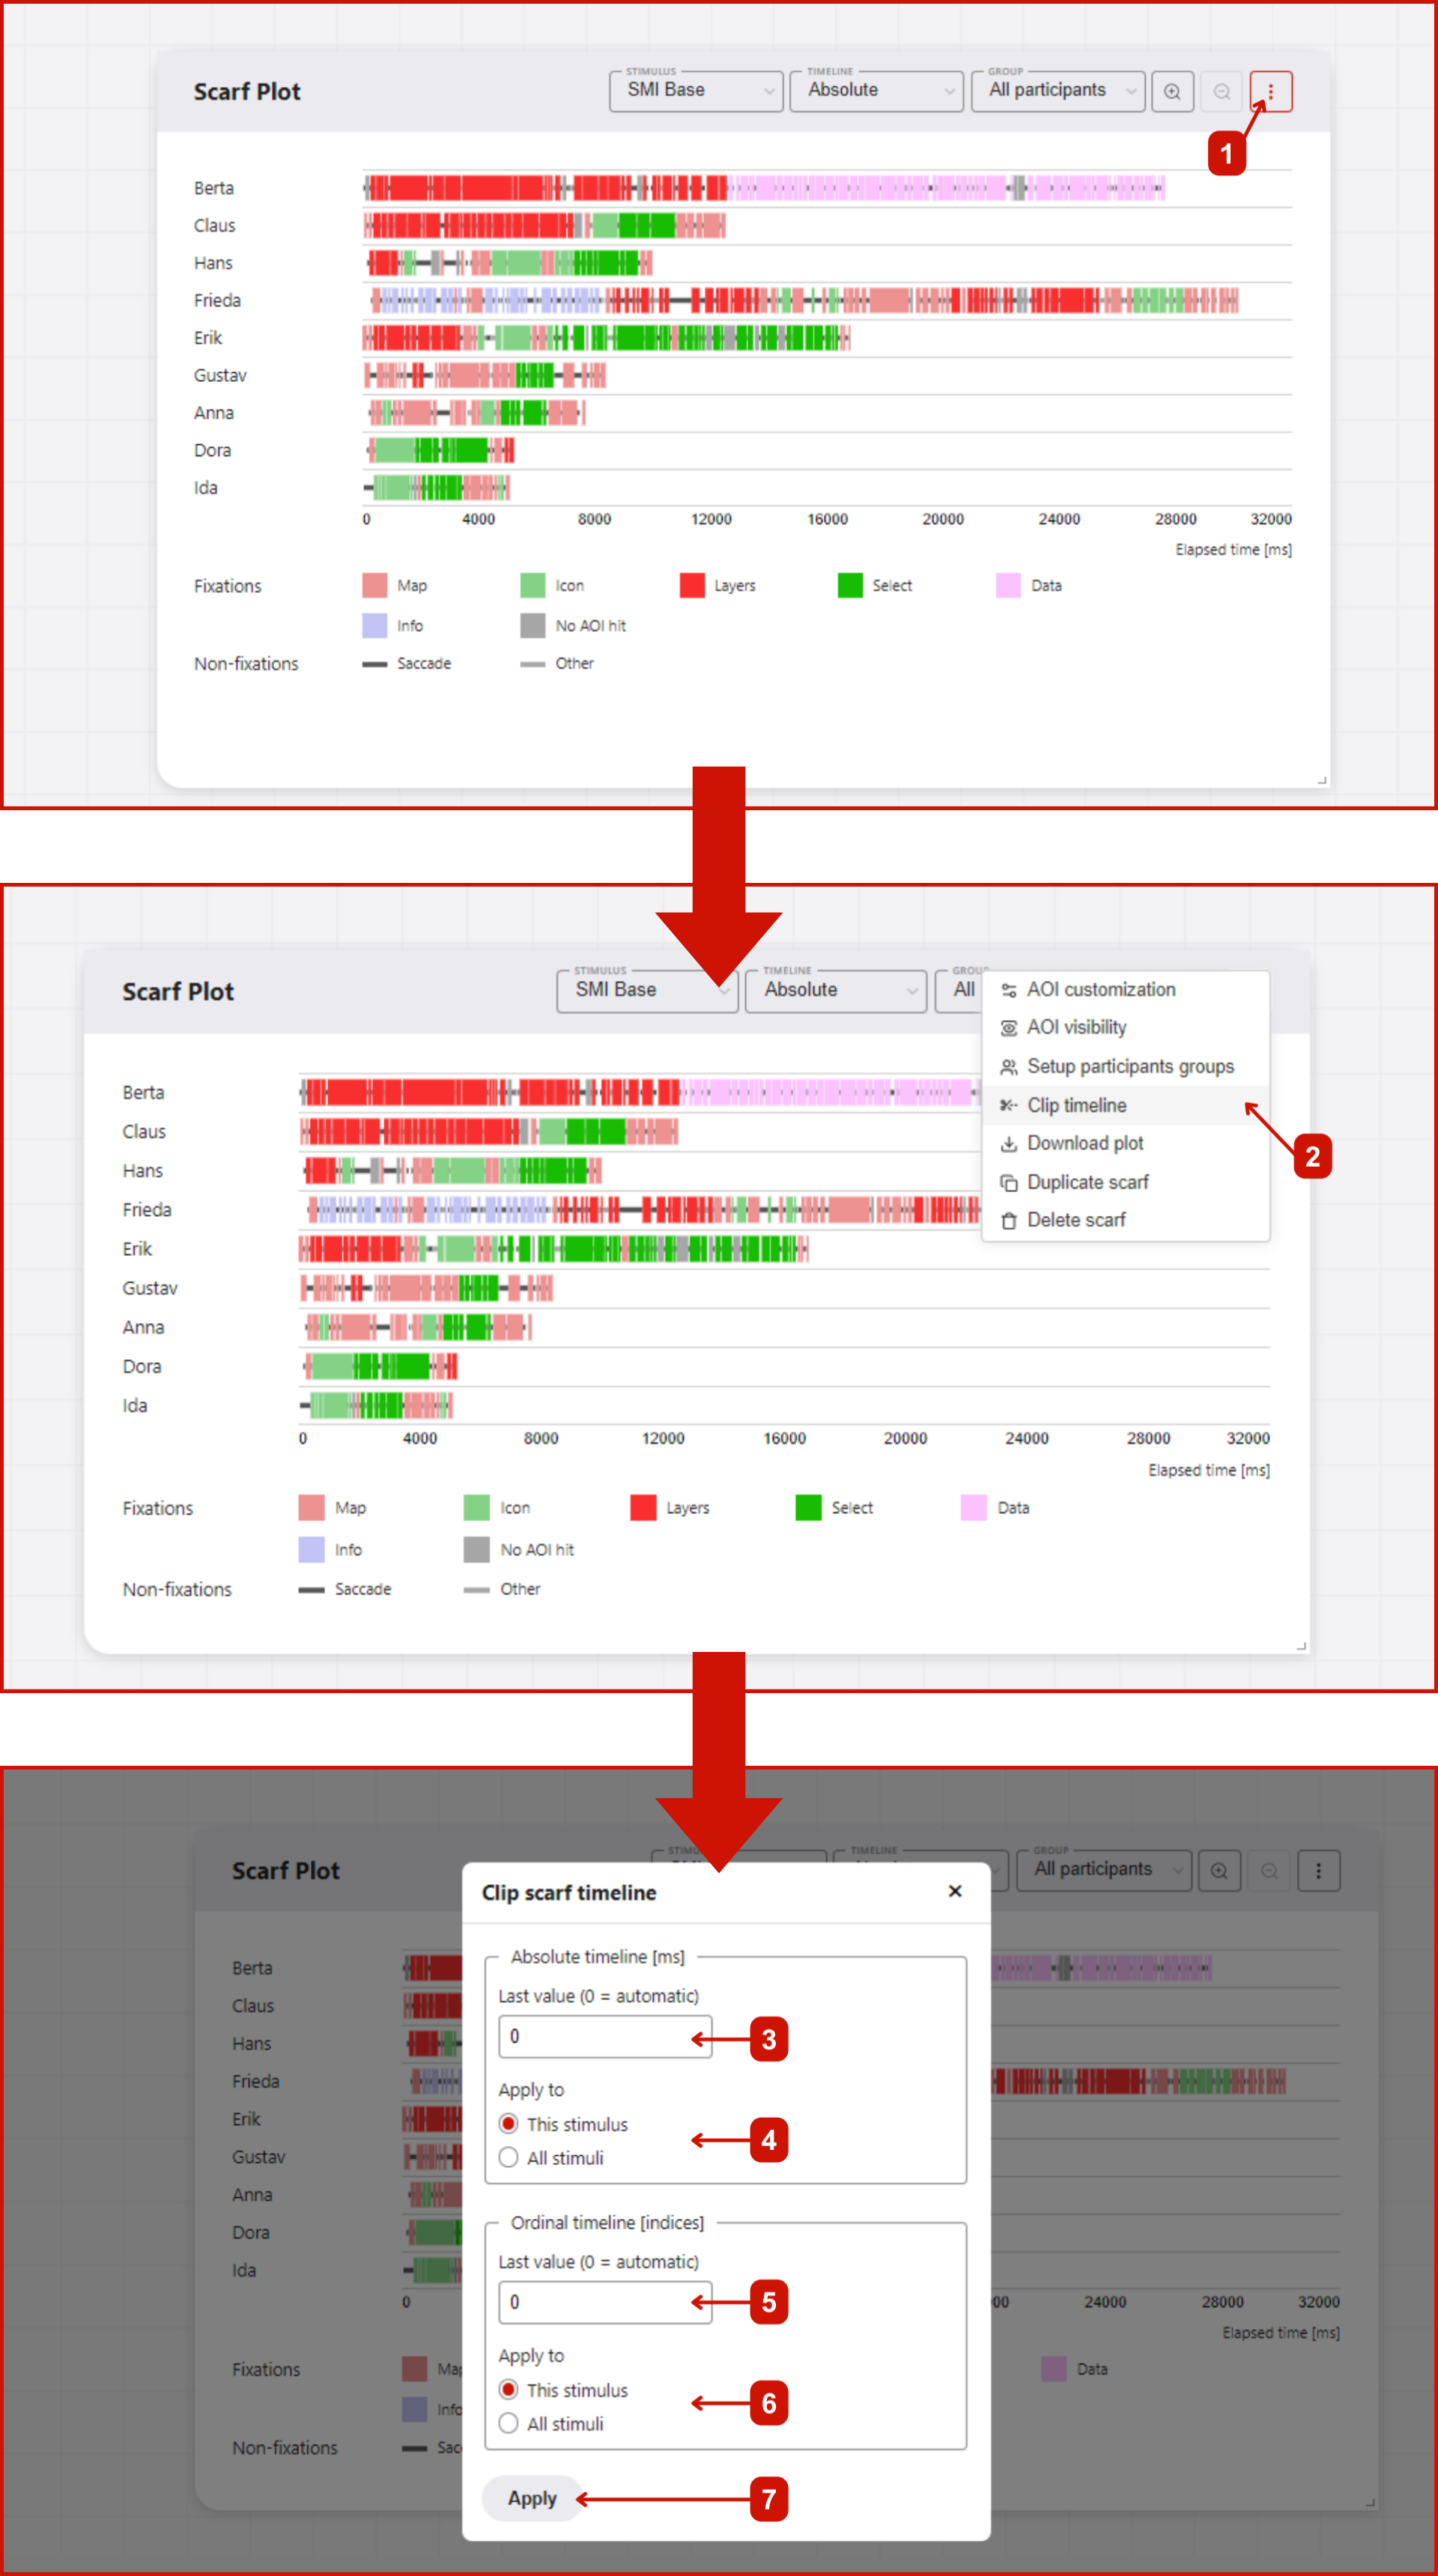
Steps and width of the absolute time timeline is by default determined automatically (value = 0). Steps and the highest value are set to display the whole timeline in a 'nice' way. You can modify the highest value of the absolute timeline and ordinal timeline by:
- Click on the
More optionsbutton in the top right corner of the scarf plot. - Select
Clip timelinefrom the pop-up menu. - In the
Clip timelinewindow, you can set the highest value of the absolute timeline inms. - Then, you choose whether to apply the changes only to the current stimulus or to all stimuli in the data.
- Similarly, you can set the highest value of the ordinal timeline in
indexvalues (e.g., if we want to keep only the first 10 eye movement segments, we set the highest value to 10). - After you are done with the changes, click on the
Applybutton. The scarf plot will be updated with the changes. Leaving theClip timelinewindow without applying the changes will discard the changes.
DANGER
If you change the width of the absolute time timeline to lower value than the width of the longest scanpath, the scanpath will be cut off.
Download Plot
Export individual scarf plots as image files through the menu button (⋮) → Download plot:
Export Options
- File formats: PNG (recommended, transparent background) or JPG (white background)
- Dimensions: Customizable width (height calculated automatically based on content)
- Quality: Adjustable DPI setting for screen (96 DPI) or print (300 DPI) use
- Margins: Configurable top, right, bottom, left margins (negative values crop the image)
- Preview: Live preview of your exported plot before downloading
Usage
- Click the menu button (⋮) in the scarf plot
- Select Download plot
- Adjust export settings as needed
- Preview your plot in the dialog
- Click Download to save the file
Export Data
Export the processed eye-tracking data for external analysis through the menu button (⋮) → Export segmented data.
This provides access to the raw fixation sequences, timing data, and AOI mappings in CSV format for analysis in R, Python, SPSS, or other statistical software.
For detailed information about data export options and formats, see Segmented Data Export.