Transition Matrix
Transition Matrix in GazePlotter provides a visual analysis of gaze transition patterns between Areas of Interest (AOIs). This heat map visualization shows how participants' gaze moves from one AOI to another, revealing scanpath patterns and visual attention flow in eye-tracking research.
Transition matrix manipulations in Workspace
Interested on how to operate with plots in general within the workspace? See:
Overview
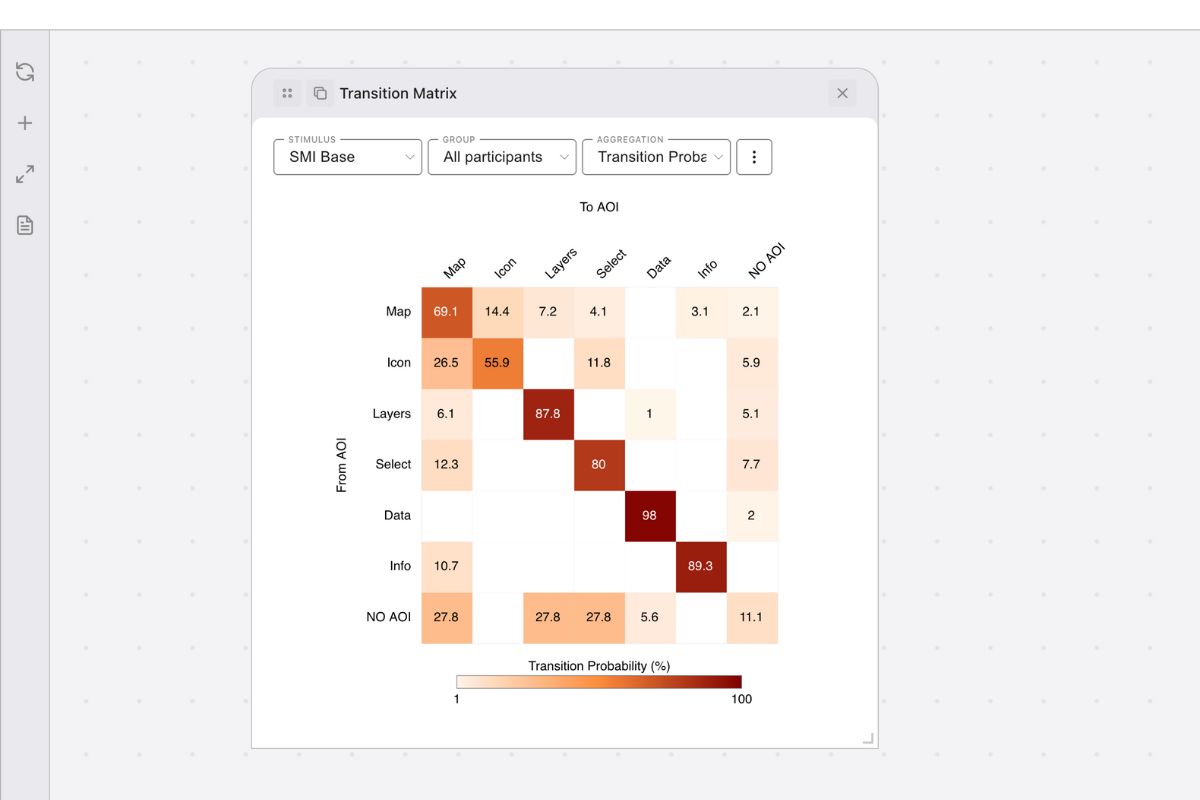
The Transition Matrix displays a square matrix where:
- Rows represent the "FROM" AOI (where gaze started)
- Columns represent the "TO" AOI (where gaze moved)
- Cell values show the strength of transitions using color intensity
- Colors range from light (few/no transitions) to dark (many transitions)
Each cell (i,j) represents transitions from AOI i to AOI j, with an additional "NO AOI" category for areas outside defined AOIs.
Main Controls
Stimulus Selection
Choose which stimulus to analyze using the Stimulus dropdown. Each stimulus contains its own set of AOIs that will be displayed in the matrix.
Group Selection
Select participant groups using the Group dropdown:
- All participants - includes data from all participants
- Custom groups - analyze specific participant groups created in the grouping interface
Aggregation Methods
The Aggregation dropdown determines how transition data is calculated and displayed:
Absolute frequency
- Description: Raw number of transitions between AOI pairs summed across all participants
- Values: Integer counts (e.g., 5, 12, 23)
- Use case: Understanding absolute frequency of gaze movements between AOIs
Relative frequency
- Description: Percentage of all transitions that occur between each AOI pair
- Values: Percentages (0-100%) where all cells sum to 100%
- Use case: Understanding the relative importance of each transition path compared to all transitions in the stimulus
1-step probability
- Description: Conditional probability of transitioning TO each AOI given you're coming FROM a specific AOI
- Values: Percentages (0-100%) where each row sums to 100%
- Use case: Understanding direct gaze flow patterns - what percentage of the time does gaze move from AOI A to AOI B?
2-step probability
- Description: Probability of reaching each AOI after exactly 2 transitions (via one intermediate AOI)
- Values: Percentages (0-100%) where each row sums to 100%
- Use case: Understanding indirect gaze patterns - what percentage of the time does gaze follow the path A→X→B?
3-step probability
- Description: Probability of reaching each AOI after exactly 3 transitions (via two intermediate AOIs)
- Values: Percentages (0-100%) where each row sums to 100%
- Use case: Understanding longer gaze sequences - what percentage of the time does gaze follow the path A→X→Y→B?
Fixation duration
- Description: Average duration of individual fixations in the "FROM" AOI before making a transition
- Values: Time in milliseconds per individual fixation
- Use case: Understanding how long single fixations last before participants move their gaze
Dwell duration
- Description: Average total duration of consecutive fixations on the same AOI before transitioning to a different AOI
- Values: Time in milliseconds for entire segments (e.g., if sequence is A,A,A,A→B, this measures total time of all A fixations)
- Use case: Understanding how long participants dwell on an AOI before switching attention, regardless of number of individual fixations
Matrix Features
Visual Encoding
- Color intensity - darker colors indicate stronger transitions
- Cell size - automatically adjusted based on number of AOIs
- Labels - AOI names displayed on both axes
- Legend - color scale with value range indicators
Interactive Elements
- Hover tooltips - display exact transition values when hovering over cells
- Menu button (⋮) - provides access to customization and export options
Customization Options
Access advanced customization through the menu button (⋮):
Color Scale Customization
- Color range - modify the color gradient used for value mapping
- Custom colors - set specific colors for minimum and maximum values
- Value thresholds - define custom minimum and maximum values for color scaling
Color Range Values
- Min/Max values - set specific thresholds for color mapping
- Auto-scaling - automatically adjust to data range when values are set to 0
- Out-of-range colors - customize colors for values below/above thresholds
Download Plot
Export individual transition matrices as image files through the menu button (⋮) → Download plot:
Export Options
- File formats: PNG (recommended, transparent background) or JPG (white background)
- Dimensions: Customizable width (height maintained as square for proper matrix proportions)
- Quality: Adjustable DPI setting for screen (96 DPI) or print (300 DPI) use
- Margins: Configurable top, right, bottom, left margins
- Preview: Live preview of your exported plot before downloading
Usage
- Click the menu button (⋮) in the transition matrix
- Select Download plot
- Adjust export settings as needed
- Preview your matrix in the dialog
- Click Download to save the file
Additional Menu Options
The transition matrix menu (⋮) provides quick access to:
- Stimulus customization - Manage stimulus properties and settings. See Stimuli Customization for details.
These options allow you to modify your data presentation without leaving the transition matrix view.
Interpretation
Use Transition Matrix in your eye-tracking analysis to:
- Identify scanpath patterns - discover common gaze movement sequences
- Compare transition frequencies - see which AOI pairs attract the most transitions
- Analyze attention flow - understand how gaze moves through your stimulus
- Detect visual hierarchies - identify which AOIs serve as "hubs" for attention
- Group comparisons - analyze how different participant groups navigate your stimulus
Reading the Matrix
- Diagonal values - transitions within the same AOI (re-fixations)
- High-value cells - common transition paths in your stimulus
- Row patterns - where gaze typically goes FROM each AOI
- Column patterns - where gaze typically comes TO each AOI
- Empty cells - transitions that rarely or never occur
Matrix Interpretation
Dark cells indicate strong transition patterns. Look for:
- Hot spots - frequently used gaze paths
- Cold spots - avoided transitions
- Row/column dominance - AOIs that attract or distribute attention